

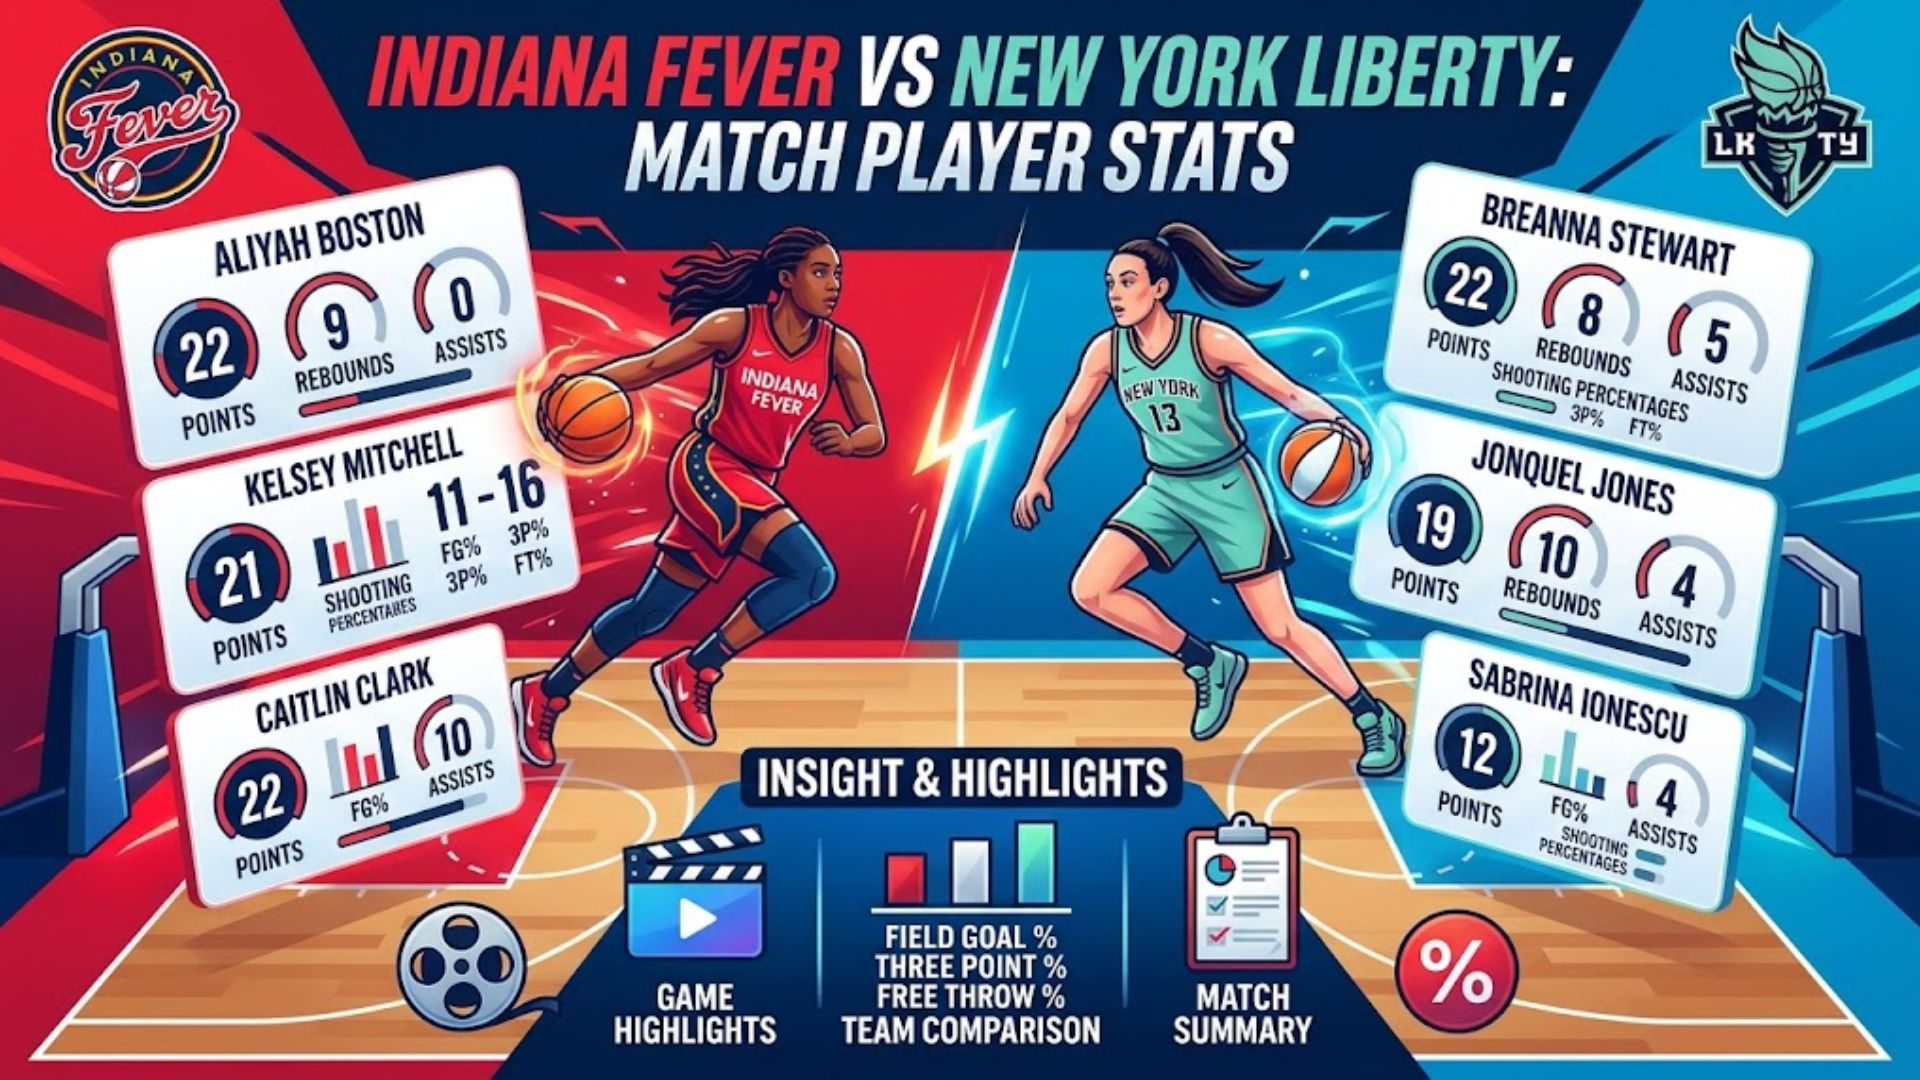
The Indiana Fever and New York Liberty bring plenty of scoring power, skilled playmakers, and exciting individual matchups to the WNBA court. When these teams meet, the final score tells only part of the story. Player statistics reveal who controlled the offense, which team won the rebounding battle, and how defensive pressure changed the game’s momentum.
For a concrete example, the July 18, 2026, regular-season matchup produced a convincing Indiana victory. The Fever defeated the Liberty 108–88 at Gainbridge Fieldhouse in Indianapolis, overcoming an early deficit with a powerful second-half performance. Kelsey Mitchell led Indiana with 33 points while Breanna Stewart scored 26 for New York. WNBA
This article examines the Indiana Fever vs New York Liberty match player stats through that game, explaining the key performances, team numbers, turning points, and lessons behind the final score. Using one clearly identified matchup also keeps the statistics consistent instead of mixing figures from different games.
Indiana Fever vs New York Liberty Match Overview
The July 18 matchup offered a useful look at how individual talent and team execution can change a WNBA game. New York started strongly, but Indiana found its rhythm after halftime and took control during the third quarter.
Indiana Fever players, basketball shoes and stats | Colendri
Indiana Fever
108
Home team
Final
July 18, 2026
Indianapolis, Indiana
New York Liberty vs Minnesota Lynx: October 1, 2026 Time, TV & Venue
New York Liberty
88
Away team
Indiana’s leading scorer
Kelsey Mitchell
33 points
New York’s leading scorer
Breanna Stewart
26 points
Quarter-by-quarter scoring breakdown
The scoring pattern explains why the final margin grew so quickly. New York built an early advantage, but Indiana responded with a dominant third quarter and continued scoring in the fourth.
| Quarter | Indiana Fever | New York Liberty |
|---|---|---|
| First | 22 | 28 |
| Second | 23 | 21 |
| Third | 30 | 12 |
| Fourth | 33 | 27 |
| Final | 108 | 88 |
Source: WNBA official box score. WNBA
New York won the opening quarter by six points. Indiana then narrowed the gap before halftime, leaving the teams separated by just four points at the break.
The third quarter became the game’s defining stretch. Indiana outscored New York 30–12, turning a close contest into a comfortable lead. The Fever added another 33 points in the fourth quarter, preventing the Liberty from mounting a serious comeback.
Indiana Fever Player Stats and Individual Performances
Indiana’s victory depended on more than one strong scorer. The Fever combined Mitchell’s efficient shooting with Caitlin Clark’s offensive contributions and a productive team effort.
Kelsey Mitchell: Indiana’s scoring leader
Kelsey Mitchell delivered the standout offensive performance, finishing with 33 points on 10-of-14 shooting. Her accuracy made the difference between simply taking a large number of shots and turning possessions into reliable scoring opportunities. WNBA
Making 10 of 14 field-goal attempts translates to approximately 71.4% shooting. That is an impressive conversion rate for a player carrying a substantial scoring load.
Mitchell also entered the game after scoring 30 points against Seattle the previous night. According to the Associated Press recap published through the WNBA, she recorded consecutive 30-point performances for the first time in her career. WNBA
Her performance illustrates three important points:
- Efficient scoring matters: A high field-goal percentage helps a team generate more points without requiring extra possessions.
- Shot creation can change momentum: Reliable scoring gives teammates room to contribute without carrying the entire offensive burden.
- Consistency builds pressure: When a scorer repeatedly converts opportunities, opponents must adjust their defensive attention.
Mitchell’s 33 points provided the biggest individual scoring contribution in the game. Indiana’s larger second-half surge, however, showed that the team could build on that production.
Caitlin Clark: Playmaking and scoring pressure
Caitlin Clark finished with 17 points as Indiana completed its 20-point victory. Her contribution came in a game that followed an extraordinary performance against Seattle, where she had recorded 45 points and 10 assists. WNBA
Clark’s role extends beyond her scoring total. As a guard who creates shots for teammates, she can influence a defense even when she doesn’t take every available attempt.
When opponents pressure the ball, passing lanes can open elsewhere. When defenders retreat to protect against drives, perimeter shooting opportunities may become available. These decisions shape offensive possessions, although the exact impact in a particular game should be assessed using its full play-by-play record.
For this matchup, Clark’s 17 points complemented Mitchell’s scoring rather than requiring one player to do everything. That balance helped Indiana sustain its offensive output across the second half.
Indiana’s supporting cast
The Fever’s supporting players also contributed to the overall result. The team scored 108 points, including 38 points in the paint and 18 fast-break points. Its bench produced 31 points. WNBA
Those totals reveal why the victory shouldn’t be reduced to Mitchell’s performance alone.
Paint scoring rewards teams that reach productive areas near the basket. Fast-break points show how effectively a team converts transition opportunities before the defense gets set. Bench scoring demonstrates that reserves can keep the offense moving when starters rest.
Together, these categories suggest Indiana found multiple routes to scoring. That variety can make a team harder to defend because opponents cannot focus on just one player or one type of shot.
Indiana Fever player stats table
The table below includes the individual statistics confirmed in the available game recap. It deliberately avoids filling unavailable fields with estimates.
| Player | Points | Additional confirmed details |
|---|---|---|
| Kelsey Mitchell | 33 | 10-of-14 field goals |
| Caitlin Clark | 17 | Contributed to Indiana’s scoring effort |
| Other Fever players | See official box score | Consult the complete individual statistics |
For a full statistical breakdown, including minutes, rebounds, assists, steals, blocks, turnovers, and three-point accuracy, use the official WNBA box score.
This distinction matters for anyone writing a sports statistics article. A correct points total does not automatically confirm a player’s rebounds or assists. Every column needs its own verified figure.
New York Liberty Player Stats and Individual Performances
New York had a strong opening quarter and received a major scoring contribution from Breanna Stewart. However, the Liberty couldn’t maintain their early advantage after halftime.
Breanna Stewart: New York’s leading scorer
Breanna Stewart led the Liberty with 26 points on 10-of-16 shooting, making approximately 62.5% of her field-goal attempts. Her scoring efficiency kept New York competitive even as Indiana increased its offensive pressure. WNBA
Stewart’s performance demonstrates why scoring totals should always be considered alongside shooting efficiency. A player who makes 10 shots from 16 attempts uses possessions more effectively than one who needs many additional attempts to reach the same total, although three-pointers and free throws also affect overall scoring efficiency.
Her output also gave New York a reliable scoring option throughout the contest. The larger challenge was maintaining that production while limiting Indiana’s offensive runs.
A few key takeaways stand out:
- Efficient finishing: Stewart converted 10 field goals and consistently contributed to New York’s offense.
- Individual production versus team results: Her 26 points were a strong individual total, but they couldn’t overcome Indiana’s second-half scoring surge.
- Defensive response: New York needed to disrupt Indiana’s rhythm more effectively after halftime.
Stewart’s performance remained one of the game’s most notable individual efforts, even though Indiana ultimately controlled the scoreboard.
Marine Johannes: An early perimeter spark
Marine Johannes scored 12 points on 4-of-8 three-point shooting, according to the game recap. All four of her three-pointers came during the opening seven minutes, giving New York an early perimeter scoring boost. WNBA
That performance is especially useful when examining shooting momentum. Four successful three-pointers can quickly increase a team’s scoring output because each made shot is worth three points.
Johannes’ early production helped New York establish its first-quarter lead. However, she left the game early in the fourth quarter with an ankle injury and did not return. The recap identifies the injury but doesn’t establish a longer-term diagnosis. WNBA
Her departure was a notable development because New York lost a player who had already demonstrated effective perimeter shooting. Still, the available evidence doesn’t establish how many additional points she would have scored or whether her presence would have changed the result.
New York’s supporting players and lineup availability
The Liberty also entered the game without Leonie Fiebich, who was dealing with a foot issue, and Satou Sabally, who was in concussion protocol, according to the game report. WNBA
Missing players can affect rotations, defensive assignments, and the amount of responsibility placed on available starters. Those effects are especially important against a team that can score heavily in transition and through its bench.
However, injuries alone don’t explain the loss. New York scored 88 points, including 32 in the paint, but Indiana created more transition opportunities and generated significantly more bench points.
New York Liberty player stats table
| Player | Points | Additional confirmed details |
|---|---|---|
| Breanna Stewart | 26 | 10-of-16 field goals |
| Marine Johannes | 12 | 4-of-8 three-pointers |
| Other Liberty players | See official box score | Consult the complete individual statistics |
The official WNBA box score provides the appropriate reference for the full lineup and each player’s individual totals.
Indiana Fever vs New York Liberty Match Player Stats: Head-to-Head Comparison
Comparing the two teams’ leading scorers reveals an important difference in this matchup. Indiana received more points from its top scorer, while New York relied heavily on Stewart and Johannes for its confirmed individual scoring highlights.
| Category | Indiana Fever | New York Liberty |
|---|---|---|
| Final score | 108 | 88 |
| Leading scorer | Kelsey Mitchell | Breanna Stewart |
| Leading scorer’s points | 33 | 26 |
| Leading scorer’s field goals | 10 of 14 | 10 of 16 |
| Confirmed second featured scorer | Caitlin Clark: 17 | Marine Johannes: 12 |
| Bench points | 31 | 16 |
| Fast-break points | 18 | 3 |
| Points in the paint | 38 | 32 |
| Turnovers | 16 | 15 |
Source: WNBA game summary and box score. WNBA
These figures highlight Indiana’s advantage in several areas. The Fever scored 20 more points overall, generated 15 more fast-break points, and received 15 more bench points.
New York committed one fewer turnover, so the result wasn’t simply a matter of the Liberty giving the ball away more often. Indiana instead gained an advantage through its scoring output and ability to convert opportunities into points.
Why the scoring comparison matters
A seven-point gap between the leading scorers may seem modest in isolation. Yet Mitchell’s 33 points came within an offense that scored 108 overall, while Stewart’s 26 points formed part of New York’s 88-point total.
The surrounding team contributions made the difference. Indiana’s bench and transition scoring supplied extra production beyond its featured starters.
This is why a useful player-stats article needs both individual and team numbers. A points leaderboard shows who scored most, while the broader box score helps explain how the entire team performed.
Team Statistics: Shooting, Rebounding, and Ball Movement
The Indiana Fever vs New York Liberty match player stats become more informative when combined with team-level indicators. These numbers reveal which areas helped Indiana build its lead and where New York struggled to keep pace.
Team scoring comparison
| Team statistic | Indiana Fever | New York Liberty |
|---|---|---|
| Total points | 108 | 88 |
| Points in the paint | 38 | 32 |
| Fast-break points | 18 | 3 |
| Bench points | 31 | 16 |
| Turnovers | 16 | 15 |
| Biggest lead | 25 | 13 |
Source: Official WNBA game summary. WNBA
Shooting efficiency and shot selection
Shooting efficiency helps explain how a team turns its possessions into points. Mitchell’s 10-for-14 performance was one clear example of Indiana’s effective scoring.
However, a complete shooting comparison should also consider three-pointers, free throws, and the total number of attempts. A team can make fewer field goals but still score effectively if it earns enough free throws or converts a high share of its three-point attempts.
The full box score is essential here. Without verified team shooting percentages for this specific game, assigning exact figures would create a misleading comparison.
Rebounding and possession control
Rebounds give teams another chance to score or help them end the opponent’s possession. Offensive rebounds can create second-chance opportunities, while defensive rebounds prevent opponents from extending their attacks.
The available game summary reports total rebounds as a team-level category, but the figures in its compact scoring table aren’t a complete breakdown of individual rebounds. Readers should consult the full box score before drawing conclusions about which player dominated the boards.
For an in-depth article, compare offensive rebounds, defensive rebounds, and total rebounds separately. That approach offers a clearer picture of possession control than relying on one combined number.
Assists and turnovers
Assists help show how often made field goals result from a teammate’s pass. They can reveal effective ball movement, although not every quality pass leads directly to an assist.
Turnovers measure possessions that end without a shot attempt or made free throw in qualifying circumstances. Indiana recorded 16 turnovers compared with New York’s 15, meaning the Fever did not win this matchup by protecting the ball better in raw turnover totals.
Instead, the larger scoring gap came alongside advantages in transition points, bench scoring, and points in the paint. That contrast is important: the team with fewer turnovers doesn’t always win the game.
Key Moments That Shaped the Game
The final score reflects several important stretches rather than one isolated play. Indiana’s ability to respond after falling behind became the defining feature of the contest.
New York’s fast start
The Liberty scored 28 points in the first quarter, compared with Indiana’s 22. Johannes’ early three-point shooting helped New York establish its offensive rhythm.
At that stage, the Fever needed to improve their scoring without allowing the deficit to grow. The next quarter gave Indiana an opportunity to recover.
Indiana’s late-second-quarter rally
Indiana used a 13–3 run late in the second quarter to reduce New York’s advantage. The Fever entered halftime trailing 49–45, leaving them only four points behind. WNBA
That rally mattered because it changed the game’s direction before the break. Rather than entering halftime facing a substantial deficit, Indiana remained close enough to take the lead early in the third quarter.
The decisive third quarter
Indiana opened the second half with greater scoring momentum. Clark converted a three-point play that gave the Fever their first lead at 50–49 early in the third quarter.
New York then struggled with turnovers. The Liberty committed nine of their 15 turnovers during the game in that quarter, while Indiana outscored them 28–12 during the period. WNBA
This stretch explains much of the final result. Indiana didn’t merely score more points; it created a gap that forced New York to chase the game.
Closing out the fourth quarter
Indiana scored 33 points in the final quarter, keeping its offense productive after the decisive third-quarter run. New York scored 27, but that wasn’t enough to erase the deficit.
The Fever’s ability to maintain their scoring pace prevented the Liberty from turning a difficult situation into a close finish.
Why the Indiana Fever Won
Indiana’s victory came from a combination of efficient scoring, transition opportunities, and stronger production from its supporting players.
The main reasons behind the win included:
- Kelsey Mitchell’s scoring efficiency: She recorded 33 points while making 10 of 14 field-goal attempts.
- A dominant third quarter: Indiana outscored New York 30–12 during the period.
- Transition scoring: The Fever produced 18 fast-break points compared with New York’s three.
- Bench contributions: Indiana received 31 bench points, nearly double New York’s 16.
- Scoring variety: Indiana generated 38 points in the paint and continued producing in the fourth quarter.
These statistics show why Indiana’s victory involved more than a strong individual performance. Mitchell provided the scoring headline, but the team also converted transition opportunities and received valuable contributions beyond its leading scorer. WNBA
Why the New York Liberty Lost
New York’s opening quarter showed that the team could score effectively against Indiana. The problem was sustaining that production as the game progressed.
The Liberty scored just 12 points in the third quarter. During that period, turnovers interrupted their possessions while Indiana built a lead.
New York also finished with only three fast-break points, compared with Indiana’s 18. That difference meant the Fever generated far more scoring in transition.
Bench production created another gap. Indiana’s reserves contributed 31 points, while New York’s bench supplied 16. A 15-point difference in bench scoring can become significant when the starters’ performances are otherwise competitive.
Stewart’s 26 points and Johannes’ early perimeter shooting gave New York important offensive contributions. However, those efforts weren’t enough to offset Indiana’s second-half surge.
The main lesson is straightforward: a strong start doesn’t guarantee a strong finish. Teams must continue creating quality shots, limit costly mistakes, and respond when opponents change the game’s momentum.
How This Matchup Fits Into the Head-to-Head Picture
A single game provides a useful snapshot, but it shouldn’t stand in for an entire season of competition.
Earlier in the 2026 season, New York defeated Indiana 83–75 on June 6. Stewart scored 30 points in that contest, helping the Liberty rally after trailing by double digits in the second half. Indiana’s Clark finished with 10 points, nine assists, and seven rebounds. WNBA
The two games illustrate how dramatically individual performances and game flow can change between meetings.
| Matchup | Result | Notable performance |
|---|---|---|
| June 6, 2026 | Liberty 83, Fever 75 | Stewart scored 30 points |
| July 18, 2026 | Fever 108, Liberty 88 | Mitchell scored 33 points |
Sources: June 6 official game summary and July 18 official game summary. WNBA+1
The June game featured a New York comeback, while July’s matchup saw Indiana take control after halftime. These contrasting outcomes demonstrate why matchup analysis should use game-specific box scores rather than general assumptions about either team.
What the Match Stats Mean for Both Teams
The July 18 result offers several useful lessons for evaluating future meetings between Indiana and New York.
For Indiana, the performance demonstrated the value of balancing individual scoring with contributions from the bench. Mitchell’s accuracy created a strong offensive foundation, while the team’s transition scoring helped widen the gap.
For New York, the game highlighted the importance of responding to momentum changes. The Liberty started well, but their third-quarter turnover problems made it harder to sustain the early advantage.
Future matchups could depend on several factors:
- Whether Indiana can continue creating transition scoring opportunities.
- Whether New York can limit turnovers during crucial stretches.
- How effectively each team defends the opponent’s leading scorers.
- Whether bench players provide consistent production.
- Which team wins the rebounding battle and converts second-chance opportunities.
These are useful areas to monitor, not guaranteed predictions. Team performance changes with player availability, lineups, coaching decisions, and game conditions.
Understanding the Most Important Basketball Statistics
If you’re comparing the Indiana Fever vs New York Liberty match player stats, it helps to understand what each category measures.
| Statistic | Meaning | Why it matters |
|---|---|---|
| PTS | Points | Measures scoring production |
| REB | Rebounds | Shows control of missed shots |
| AST | Assists | Tracks passes leading directly to made field goals |
| FG% | Field-goal percentage | Measures accuracy on field-goal attempts |
| 3P% | Three-point percentage | Measures accuracy from beyond the arc |
| FT% | Free-throw percentage | Measures accuracy at the free-throw line |
| STL | Steals | Tracks defensive plays that take possession away |
| BLK | Blocks | Measures shots blocked by defenders |
| TO | Turnovers | Tracks possessions lost through turnovers |
| MIN | Minutes played | Shows how much playing time a player received |
Two players with similar scoring totals can influence a game in very different ways. One might score efficiently, while another creates opportunities for teammates through assists. A center may contribute through rebounds and blocks even without leading the team in points.
For that reason, the most useful analysis considers multiple categories together. Scoring remains important, but it rarely explains the entire game.
Frequently Asked Questions
Who scored the most points in the Indiana Fever vs New York Liberty game?
Kelsey Mitchell led all scorers with 33 points in Indiana’s 108–88 victory on July 18, 2026. She made 10 of 14 field-goal attempts. WNBA
How many points did Caitlin Clark score against the New York Liberty?
Clark scored 17 points in the July 18, 2026, matchup. Her performance helped Indiana complete its second-half comeback. WNBA
Who was the New York Liberty’s leading scorer?
Breanna Stewart led New York with 26 points, shooting 10-for-16 from the field. Marine Johannes added 12 points, including four three-pointers. WNBA
What was the final score of the game?
Indiana defeated New York 108–88 at Gainbridge Fieldhouse in Indianapolis on July 18, 2026. WNBA
Which team had the stronger bench performance?
Indiana had the advantage, scoring 31 bench points compared with New York’s 16. That 15-point difference contributed to the Fever’s overall scoring advantage. WNBA
Where can fans find the complete player box score?
The official WNBA game page is the best starting point for verified individual and team statistics. It also provides access to game charts and play-by-play information.
Which player had the biggest impact on the game?
Mitchell delivered the leading scoring performance with 33 points on highly efficient shooting. Stewart also had a strong individual game with 26 points. Indiana’s third-quarter surge, transition scoring, and bench production helped turn those individual performances into a team victory. WNBA
Conclusion: Indiana Fever vs New York Liberty Match Player Stats
The July 18, 2026, matchup showed how quickly a WNBA game can change when one team combines efficient scoring with strong team execution. Indiana defeated New York 108–88 after overcoming an early deficit and dominating the third quarter.
Kelsey Mitchell led the Fever with 33 points, while Caitlin Clark contributed 17. Breanna Stewart scored 26 for the Liberty, and Marine Johannes added 12 points through effective early three-point shooting.
The team statistics explain the final result. Indiana recorded 18 fast-break points to New York’s three and received 31 bench points compared with the Liberty’s 16. Those advantages helped Indiana build a lead that New York couldn’t overcome.
For readers following Indiana Fever vs New York Liberty match player stats, the key takeaway is to look beyond the leading scorer. Points, shooting efficiency, turnovers, transition scoring, and bench production work together to tell the full story.
As future meetings unfold, official box scores will remain the most reliable way to compare individual performances, identify emerging trends, and understand what ultimately decides each matchup.

All about grammar and text in meanings